Last time I addressed some basics of the Internet of Things based on what appears to be a fundamental misunderstanding by lots of people. I also ventured into the area of wireless, batteryless devices to consider how they will be deployed in much larger numbers than their heavyweight counterparts that have on-board microprocessors running network stacks. Those concepts will also be applicable this time around as we delve into Big Data. Just like last time, it’s based on some questions I hear a lot. “What’s all this about big data? I get we’re generating tons of data, but what does that do for me? How is big data improving my life?”
I’ve always found that when people, especially lots of people, are asking about how a technology is affecting them directly, the best answer is to provide a compelling example. And for big data I have just that.
I have an office-to-office, Massachusetts-Connecticut commute that I travel frequently – almost once a week. Over the years I’ve collected a lot of my own data about traffic patterns but in an ad hoc manner. Recently Google has added a new feature to their Maps web application that allows you to input the day and time that you plan to depart. Then, based on the years of data that Google has collected, Google Maps will update its prediction of how long your journey will take. Sounds pretty cool right?Let’s see what we can do with that. For my weekly commute I scraped a bunch of data from Google Maps. Here’s what I found: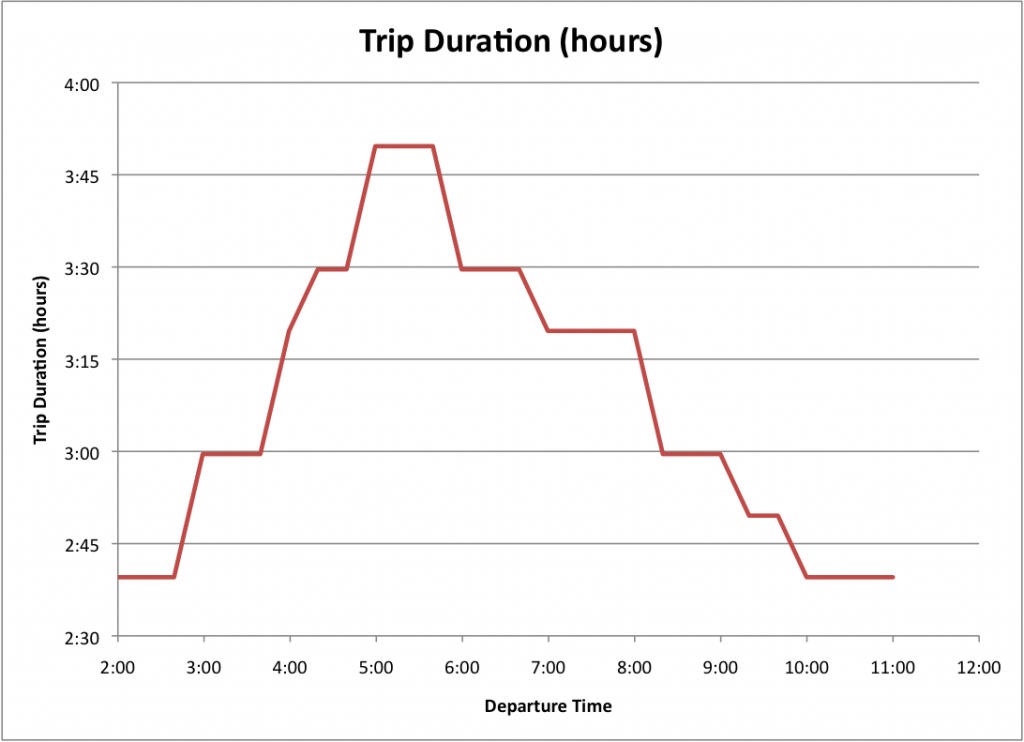
The chart shows how long my trip will take, based on what time I leave in the morning. Only somewhat to my surprise, you can see that 5 am is the worst time to leave. This is the type of traffic behavior that makes people say “If I leave at 6, I’ll actually get there earlier than if I leave at 5.” They’re kidding right? But I’m pretty sure a lot of the time when I hear this someone is being deadly serious. Let’s have another look at the data. Using the same data set, it’s possible to calculate my arrival, based again on what time I leave in the morning.
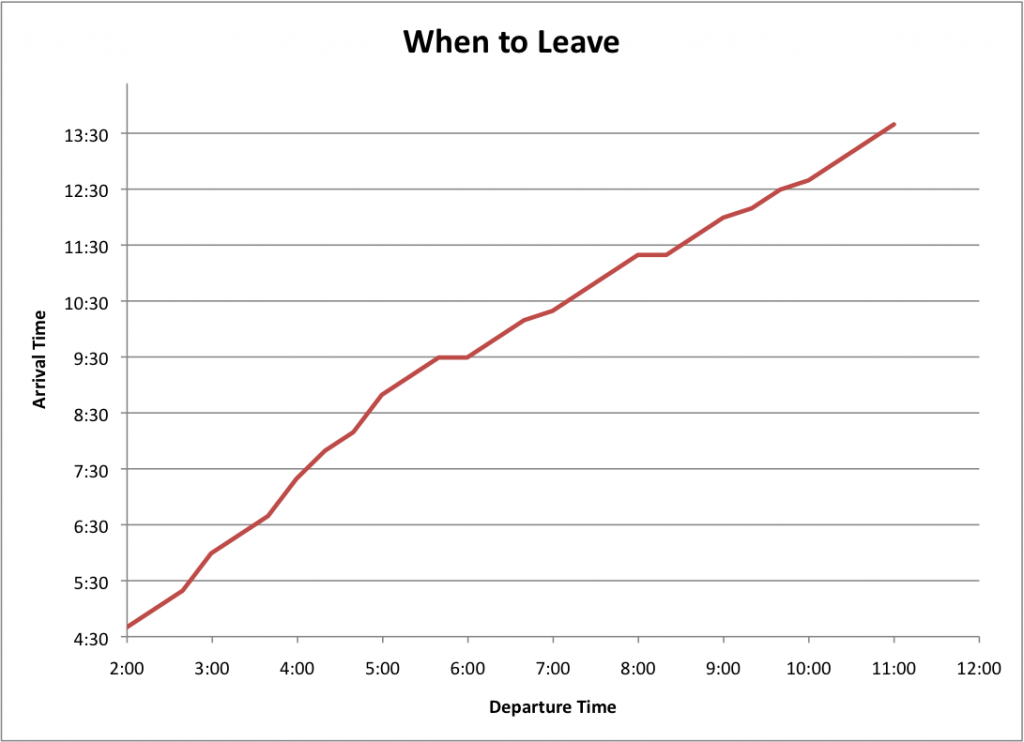
This chart is pretty useful if there’s a specific time I need to be in the destination office, say for a meeting. It also disproves the notion that you can arrive earlier by leaving later. For that to happen, the slope would need to turn negative somewhere along that line. (Ok, I didn’t actually need a chart to disprove such a conjecture, but some people are so hard to sway without data.
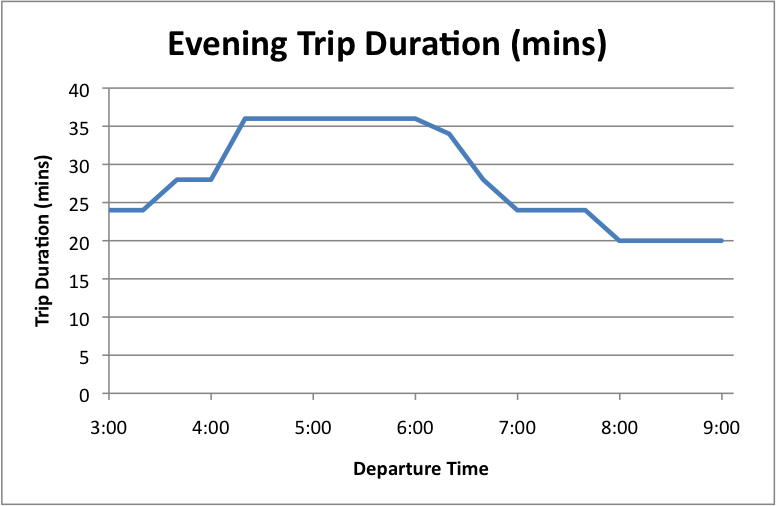
This can also be done for local commutes. Here are similar charts for typical morning and evening commutes in the Waltham-Concord corridor. In the Boston area, you almost can’t get up early enough to beat the traffic.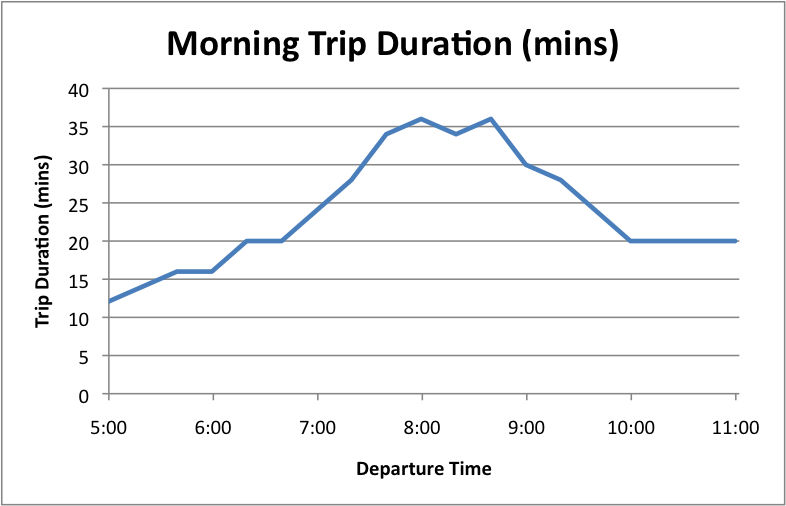
Now you have to admit, this is pretty useful stuff. Something that can affect your everyday life by allowing you to make better decisions. And these insights come to you courtesy of the mountains of traffic data that Google has amassed over the years. That’s what allows them to predict with reasonable accuracy, how long your journey will take at some point in the future, right down to 2 minute resolution. There it is: big data making your life easier.
The next thing to consider is where all this data comes from. Google does a great job of collecting data from as many sources as possible, and in the earliest days of Maps that meant things like car and taxi fleets but mostly direct traffic monitoring by municipalities. In high traffic areas, wire-loop sensors in the road bed along with video cameras are installed by government departments of transportation. The sensors and cameras provide data on the volume and speed of passing cars in real time. Some agencies make that data publicly available while others sell the data to tv and radio shows and services like Google’s. The problem with this approach is that it’s expensive to install and these days a lot of the sensors no longer work. Most roads are not monitored at all. This approach worked to some extent, but there was so little data available that it was hard to rely on and for a lot of people it simply didn’t help.
These days the great majority of traffic data is crowdsourced. Cellular service providers know the location and speed of your phone and often make aggregated versions of it available for traffic monitoring. And assuming you’ve opted in, whenever you use the Google Maps app on your phone, Google is using you to monitor traffic flow and to add to their mountain of data. These days there’s so much data out there for the taking, if a tie-up happens on a side street in your sleepy little bedroom town, it will probably show up on Google Maps.
This example is a great illustration of where Tego is heading with its IoT strategy. There’s data from many sources and many types of sources, all coming together to provide something that was unavailable just a few years ago. Some of those sources are powerful, expensive and installed for just one purpose, like the loop sensors and cameras. Others, like the swarm of smart phones out there, are small, wireless, mobile, and have a different primary purpose, but throw off so much data that they can now serve many more purposes. Sure, in this case the smart phones are enormously powerful and have big batteries that need to be charged daily, but in many cases those endpoints will be batteryless with much less compute power, but they will be deployed in such large numbers that, taken collectively, their data becomes much more useful, accurate, and multi-purpose. Just like in the traffic example. Awesome examples to follow…